Introduction
The role of batters in cricket is to make as many runs as possible for their team, and sometimes, especially in test cricket, to also play as many balls as possible. In T20 cricket, due to the short format, batters can take more risks than in the other longer formats, and hence an increasing emphasis is on scoring as many runs as possible in as little balls as possible. Of course, this doesn’t automatically imply that batters always take risks as it can mean that the team runs out of specialized batters with many overs still left to play. Batters take more risks than in ODIs or tests, thereby allowing quicker scoring, while also spacing out these risks appropriately, to be able to playing out the allotted 20 overs. T20 cricket has also led to very specialized roles for batters and a lot of emphasis is given to ensuring that the best hitters get enough balls to showcase their skills.
In the last 14 years since IPL began in 2008, batters in the debatably world’s premier T20 tournament have employed various strategies to make these quick runs. Depending on whether the batter is an opener, a middle-order batter or a finisher, different teams and batters have developed diverse templates. In this project, I investigated individual batter templates and strategies, and their impact on the team’s winning consequences.
The trade-off between strike-rate and risk
The trade-off between risk and strike-rate takes the center stage in individual batter strategies. A batter willing to take more risk has access to a wider range of shots for each ball, often diverging employing shots that diverge from the prescribed shots in the coaching manual. Some batters like Andre Russell score quick runs while taking more risks. This increases their chance of getting out each ball, and thereby they end up playing fewer balls. Such finishers usually come later in the innings when there aren’t a lot of balls left. Some teams like the Kolkata Knight Riders have often sent out “pinch hitters” like Sunil Narine earlier in the innings, often as an opener. On the other hand, batters like AB de Villiers and Jos Buttler switch gears between low and moderate risk. But even at the highest risk, the emphasis is slightly more on surviving to play another ball than is for batters like Andre Russell. More conventional batters like Mike Hussey, Tendulkar and Kallis rely heavily on a risk-minimal approach unless the situation strongly demands otherwise.
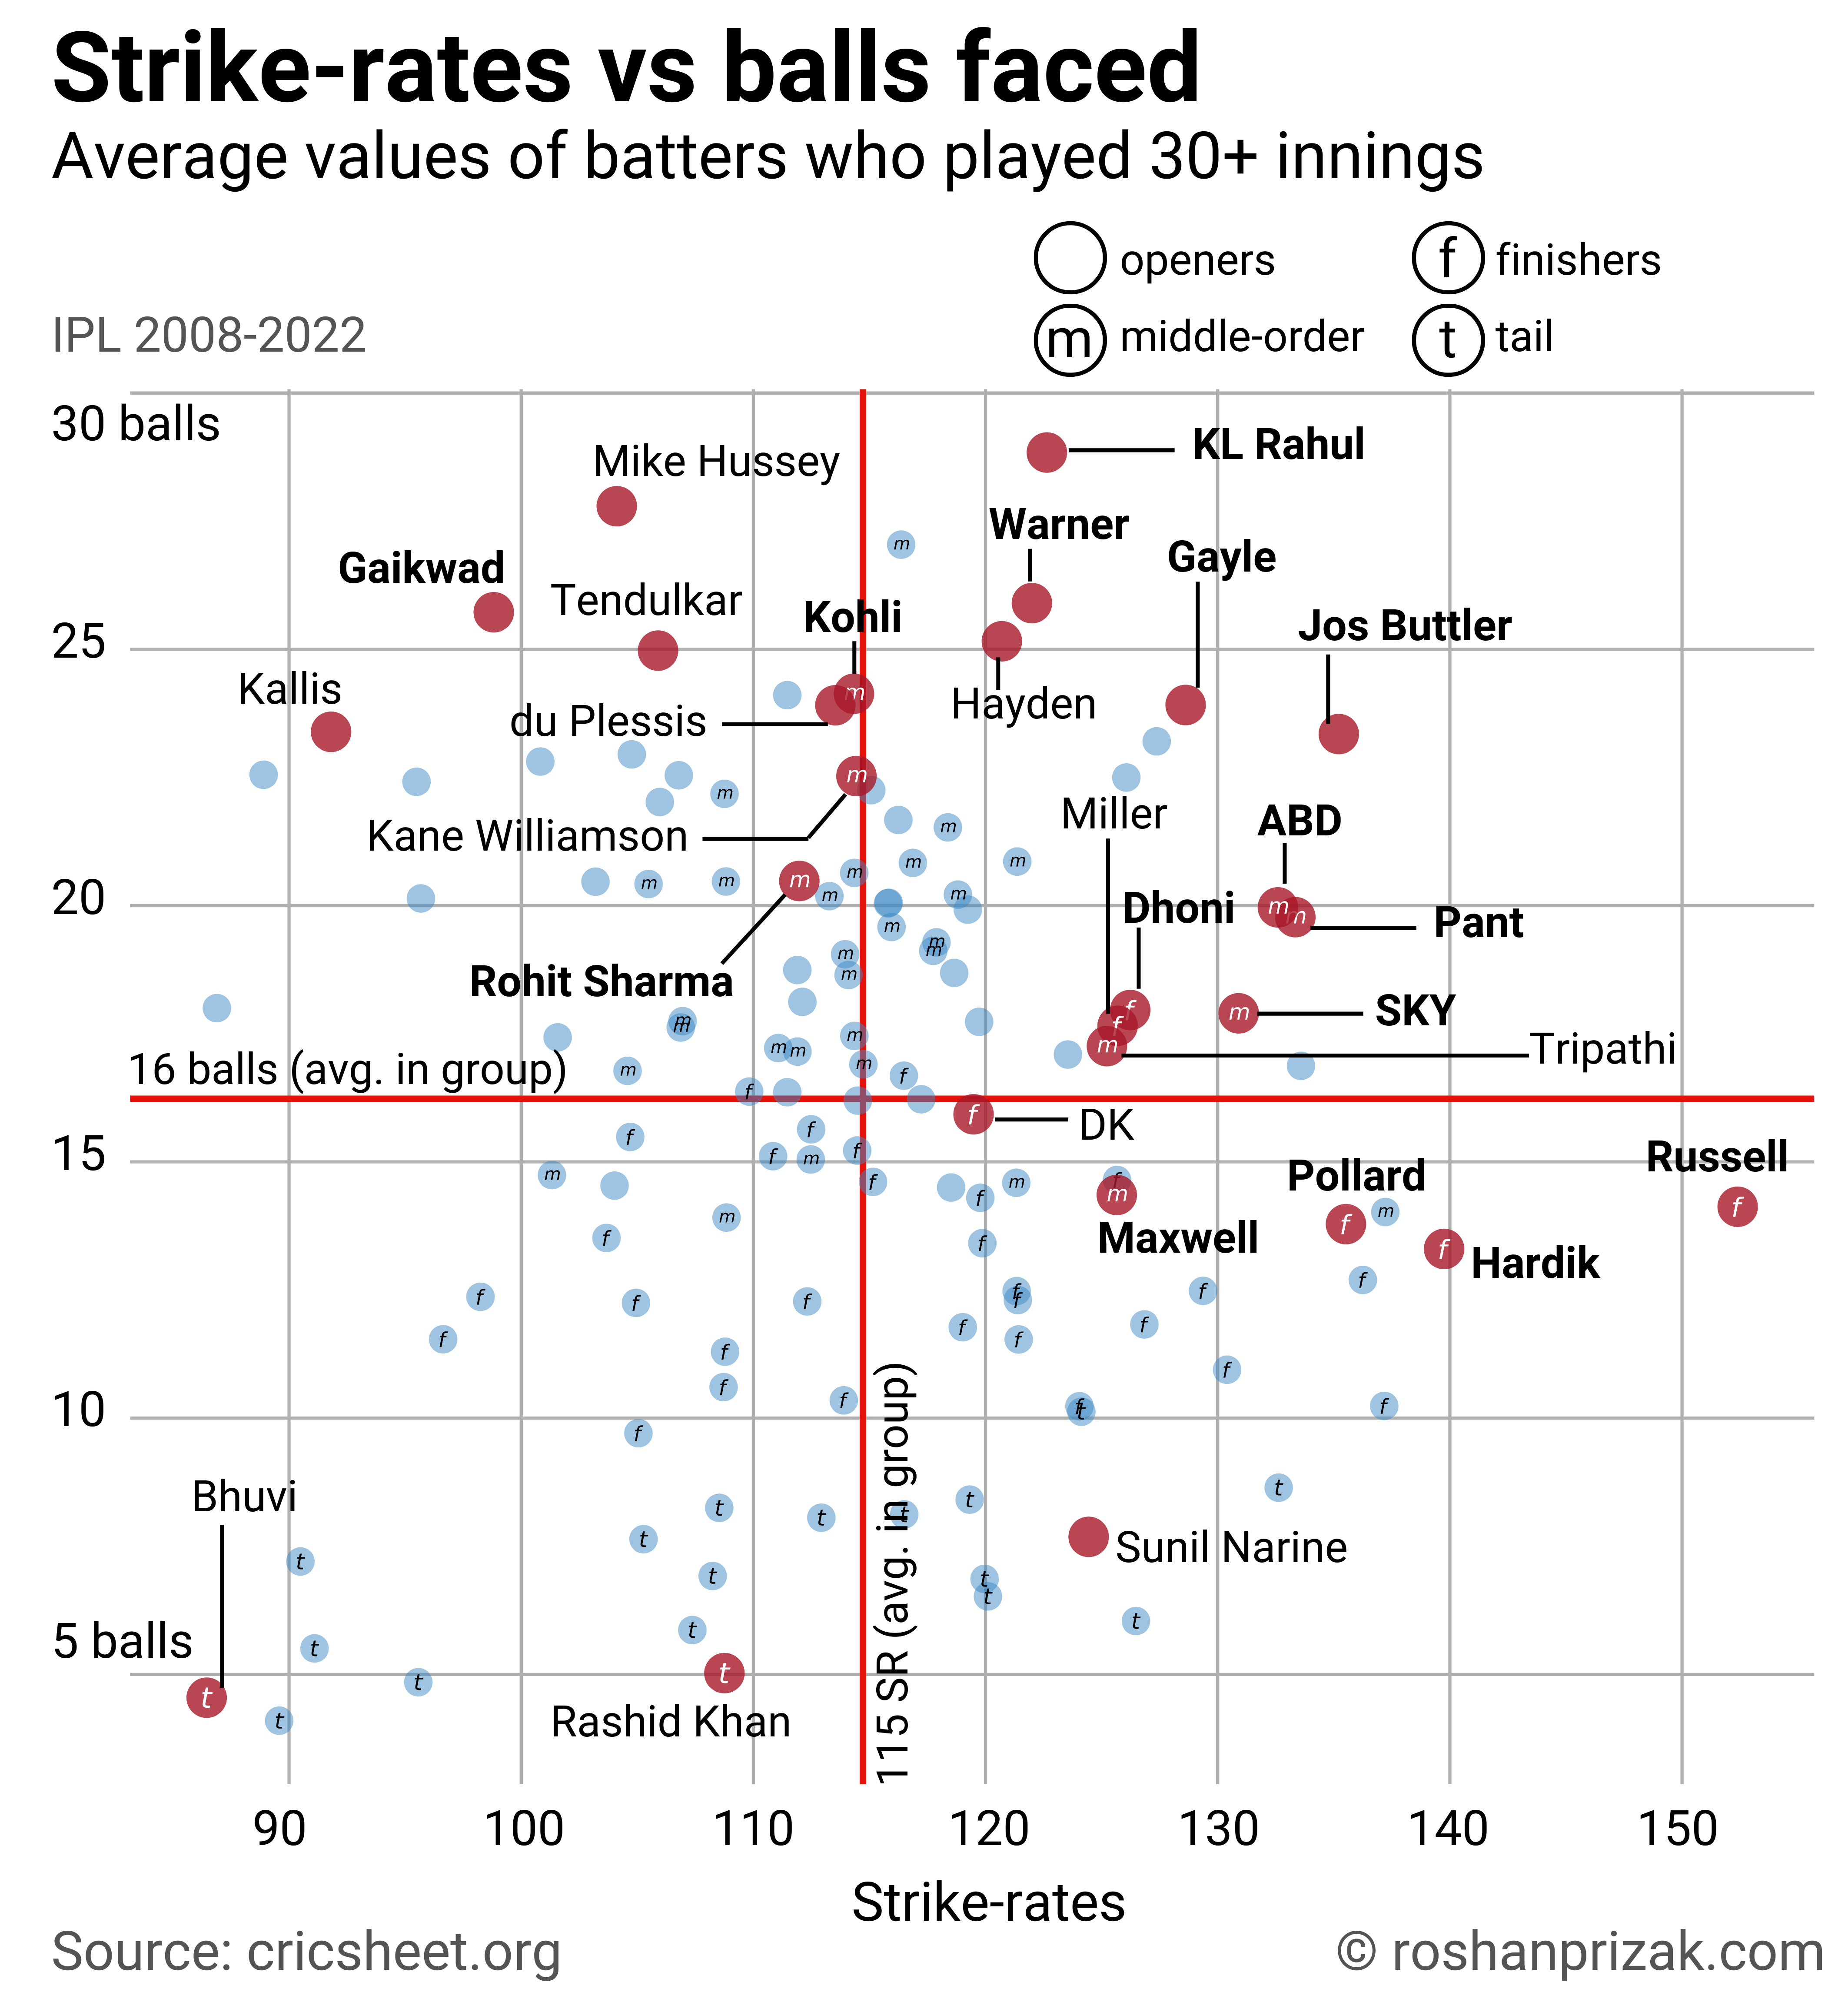
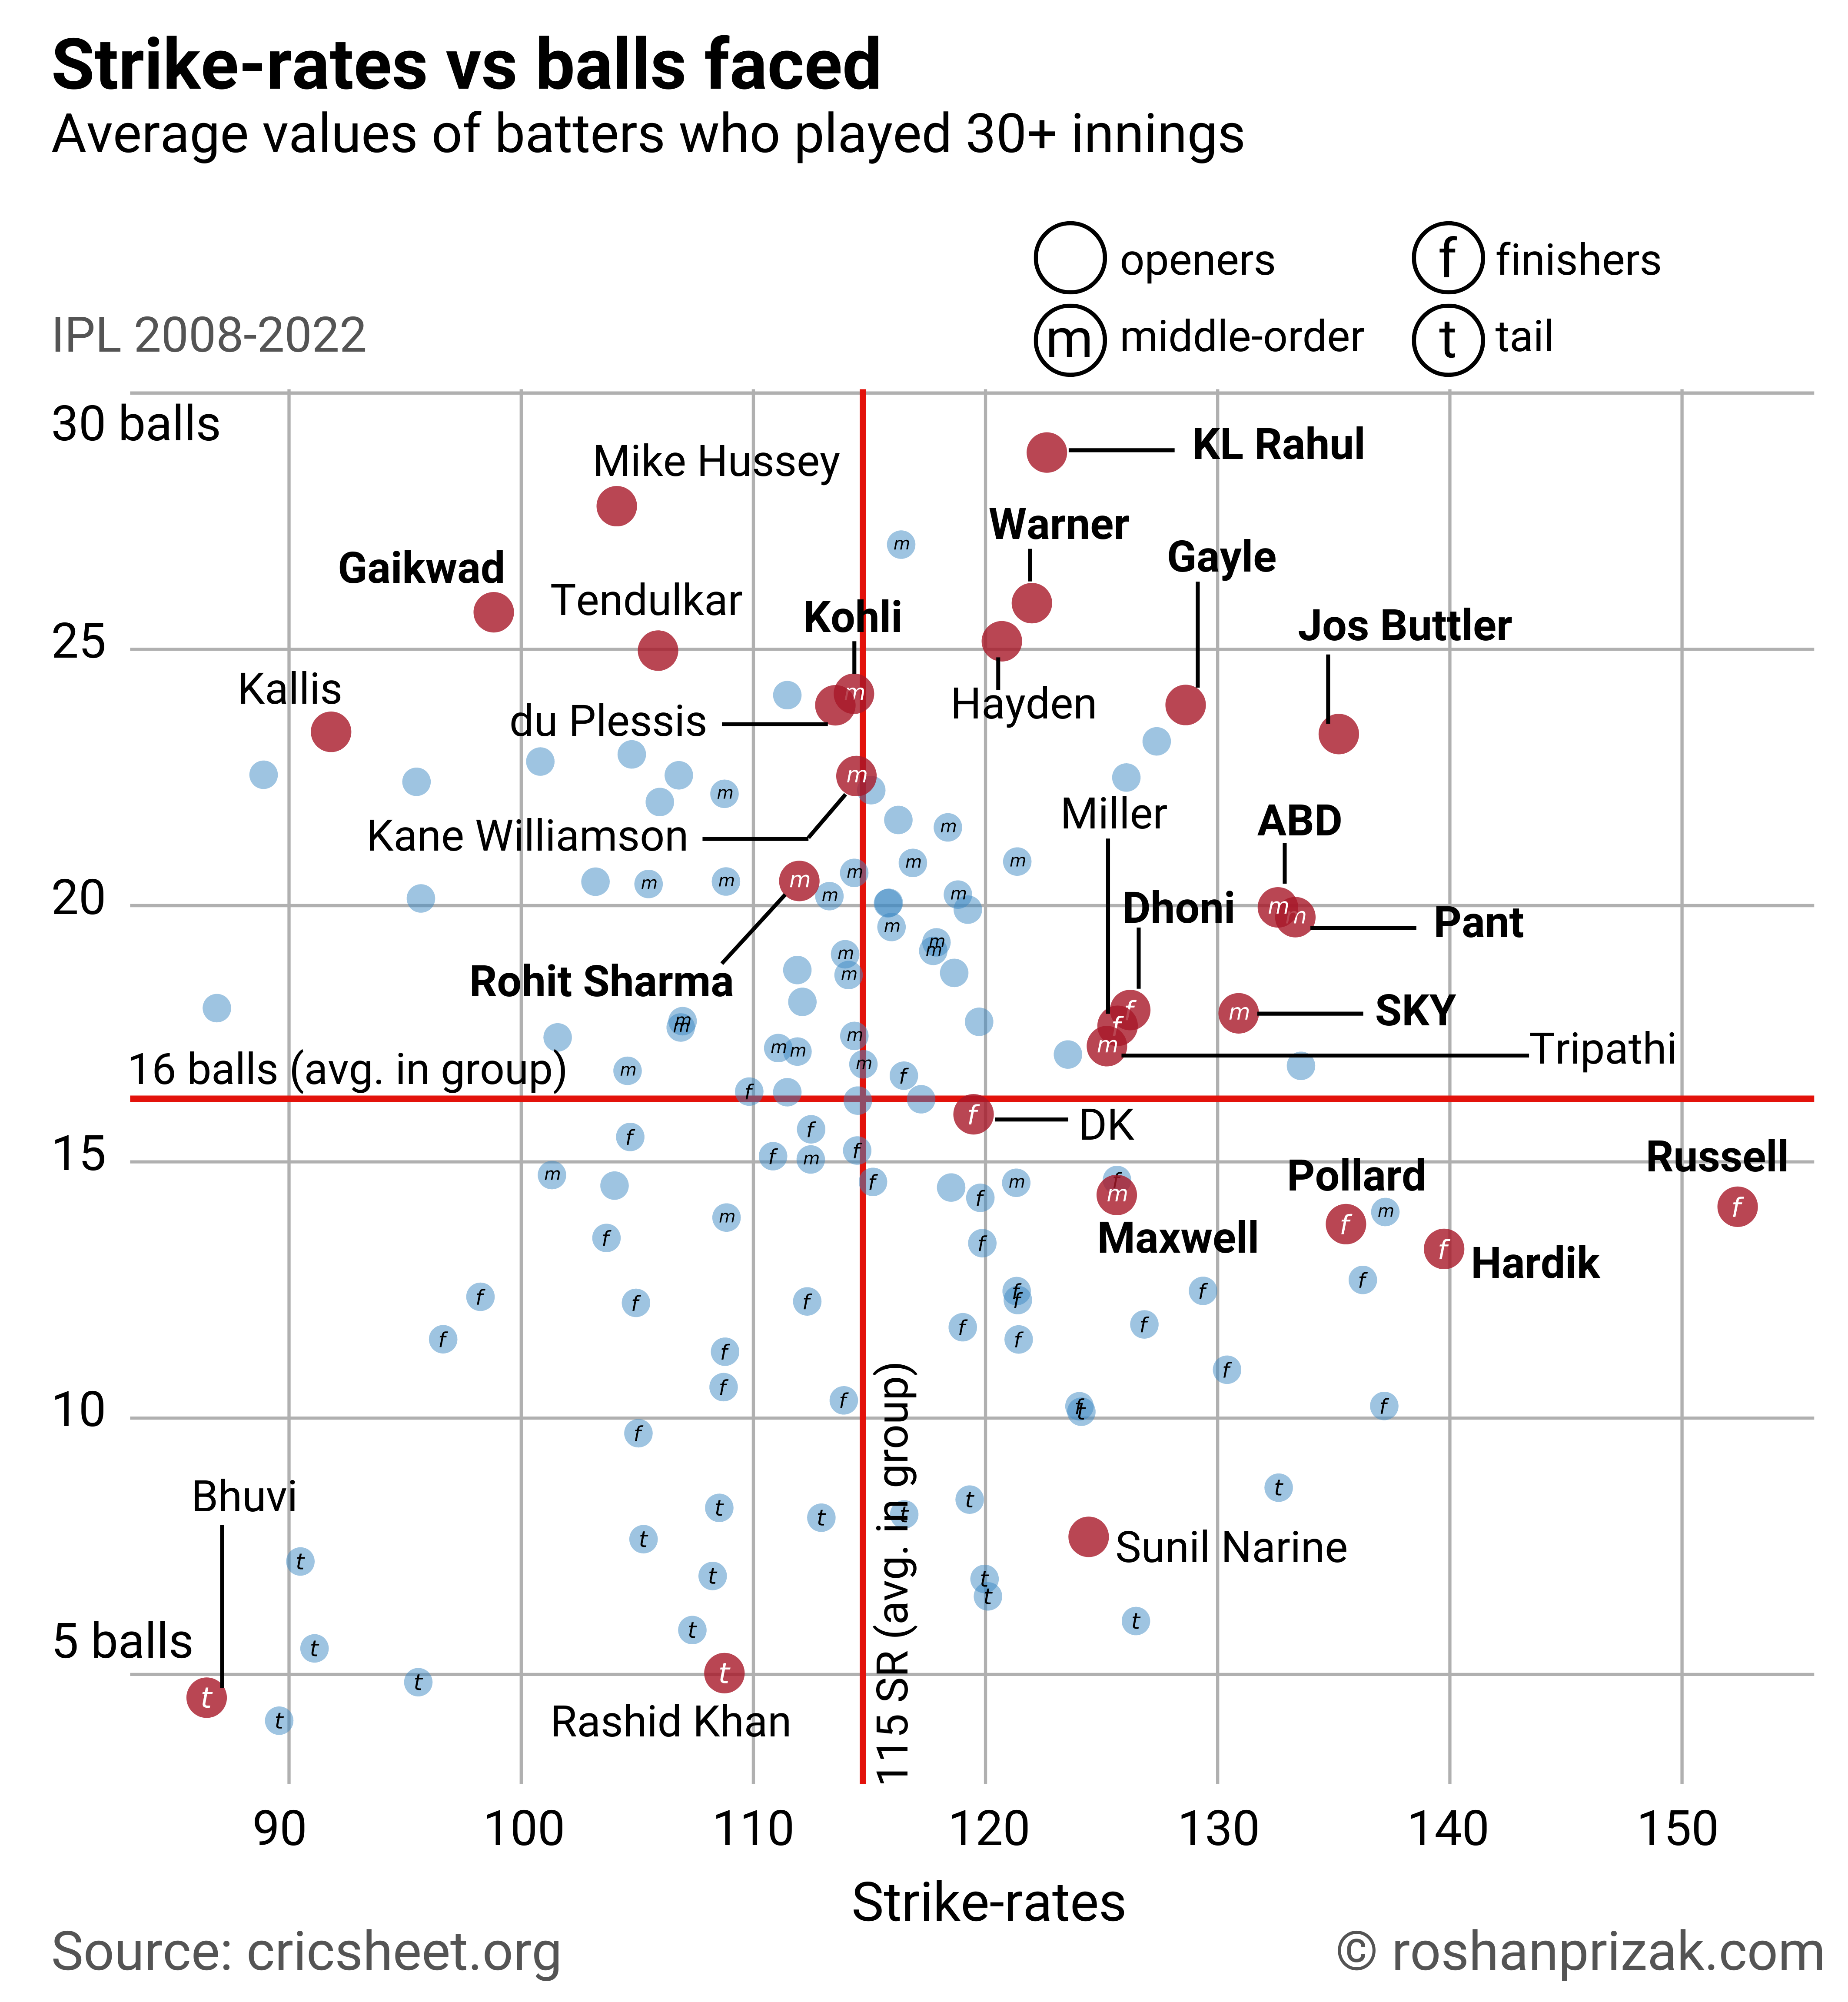
The figure above illustrates some aspects of this trade-off. Keeping tail-enders aside, notice that batters are spread on the diagonal from the top left to the bottom right. Classical players like Mike Hussey, Kallis, Tendulkar and Gaikwad are in the top left quarter - they play more balls than most others and hit at a lower strike-rate than most others. As we move through the large group of unnamed batters marked in blue, we find another group of players like Maxwell, Pollard and Hardik Pandya who play fewer balls than most others and hit at a higher rate than most others. Some notable exceptions are batters who seem to escape this trade-off, or perhaps push it to its limits - KL Rahul, Jos Buttler, AB de Villiers, Warner, Gayle, Russell and the like.
Openers play more balls than the other batter types while also exhibiting a wide range of strike-rates. For example, Gaikwad’s average strike-rate is just short of 100 and Jos Buttler’s is around 135. Gaikwad, however, typically plays a few more balls than Jos Buttler. How do these different strategies impact the match outcome?
Strategy differences between winning and losing
Separating the innings played by each batter into two groups based on whether their team won or lost the match, we can measure how different the batters strategies are in the two groups.
Instead of measuring the difference between mean strike-rate in wins and mean strike-rate in losses for each batter, we use percentile scores. The mean percentile score from strike-rates in wins (losses) tells us overall in all innings, how often the batter scores slower than they typically score at in wins (losses). The difference between these two values (wins minus losses) quantifies the typical increase (if positive) or decrease (if negative) of strike-rates from losses to wins. A similar logic applies for balls faced - the difference between mean percentile scores in wins and losses quantifies the typical increase (if positive) or decrease (if negative) in the number of balls faced from losses to wins.
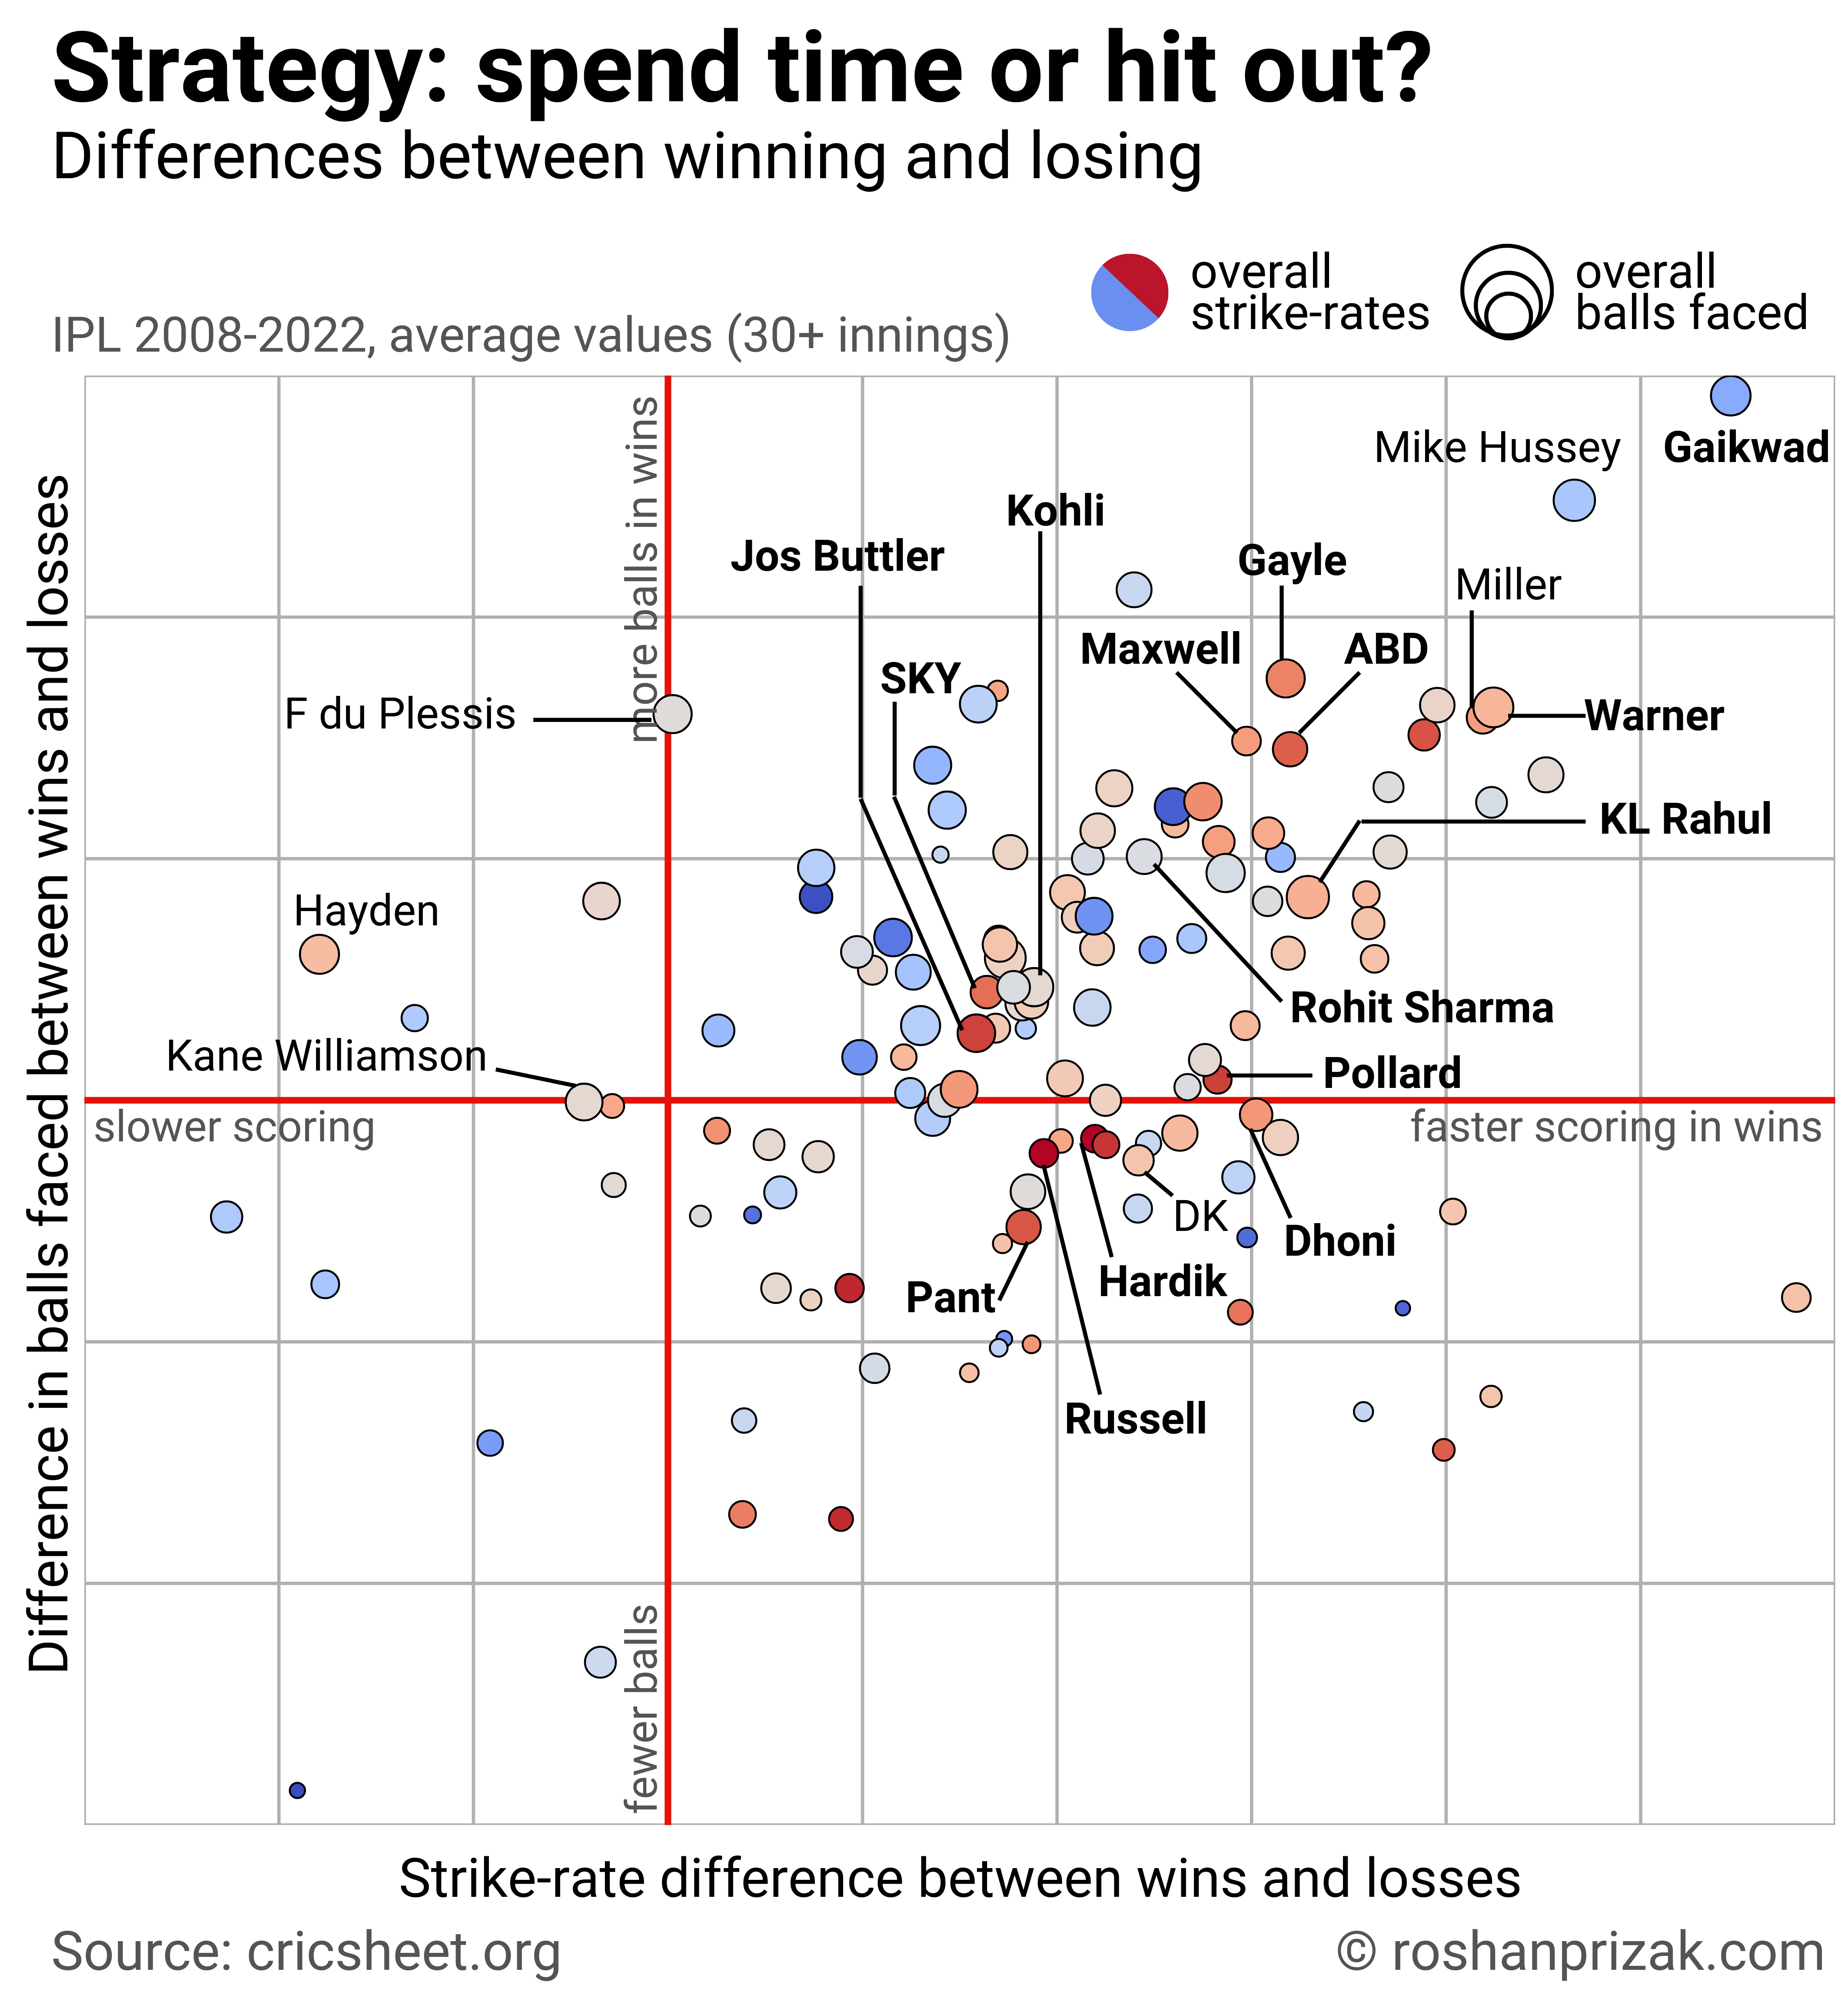
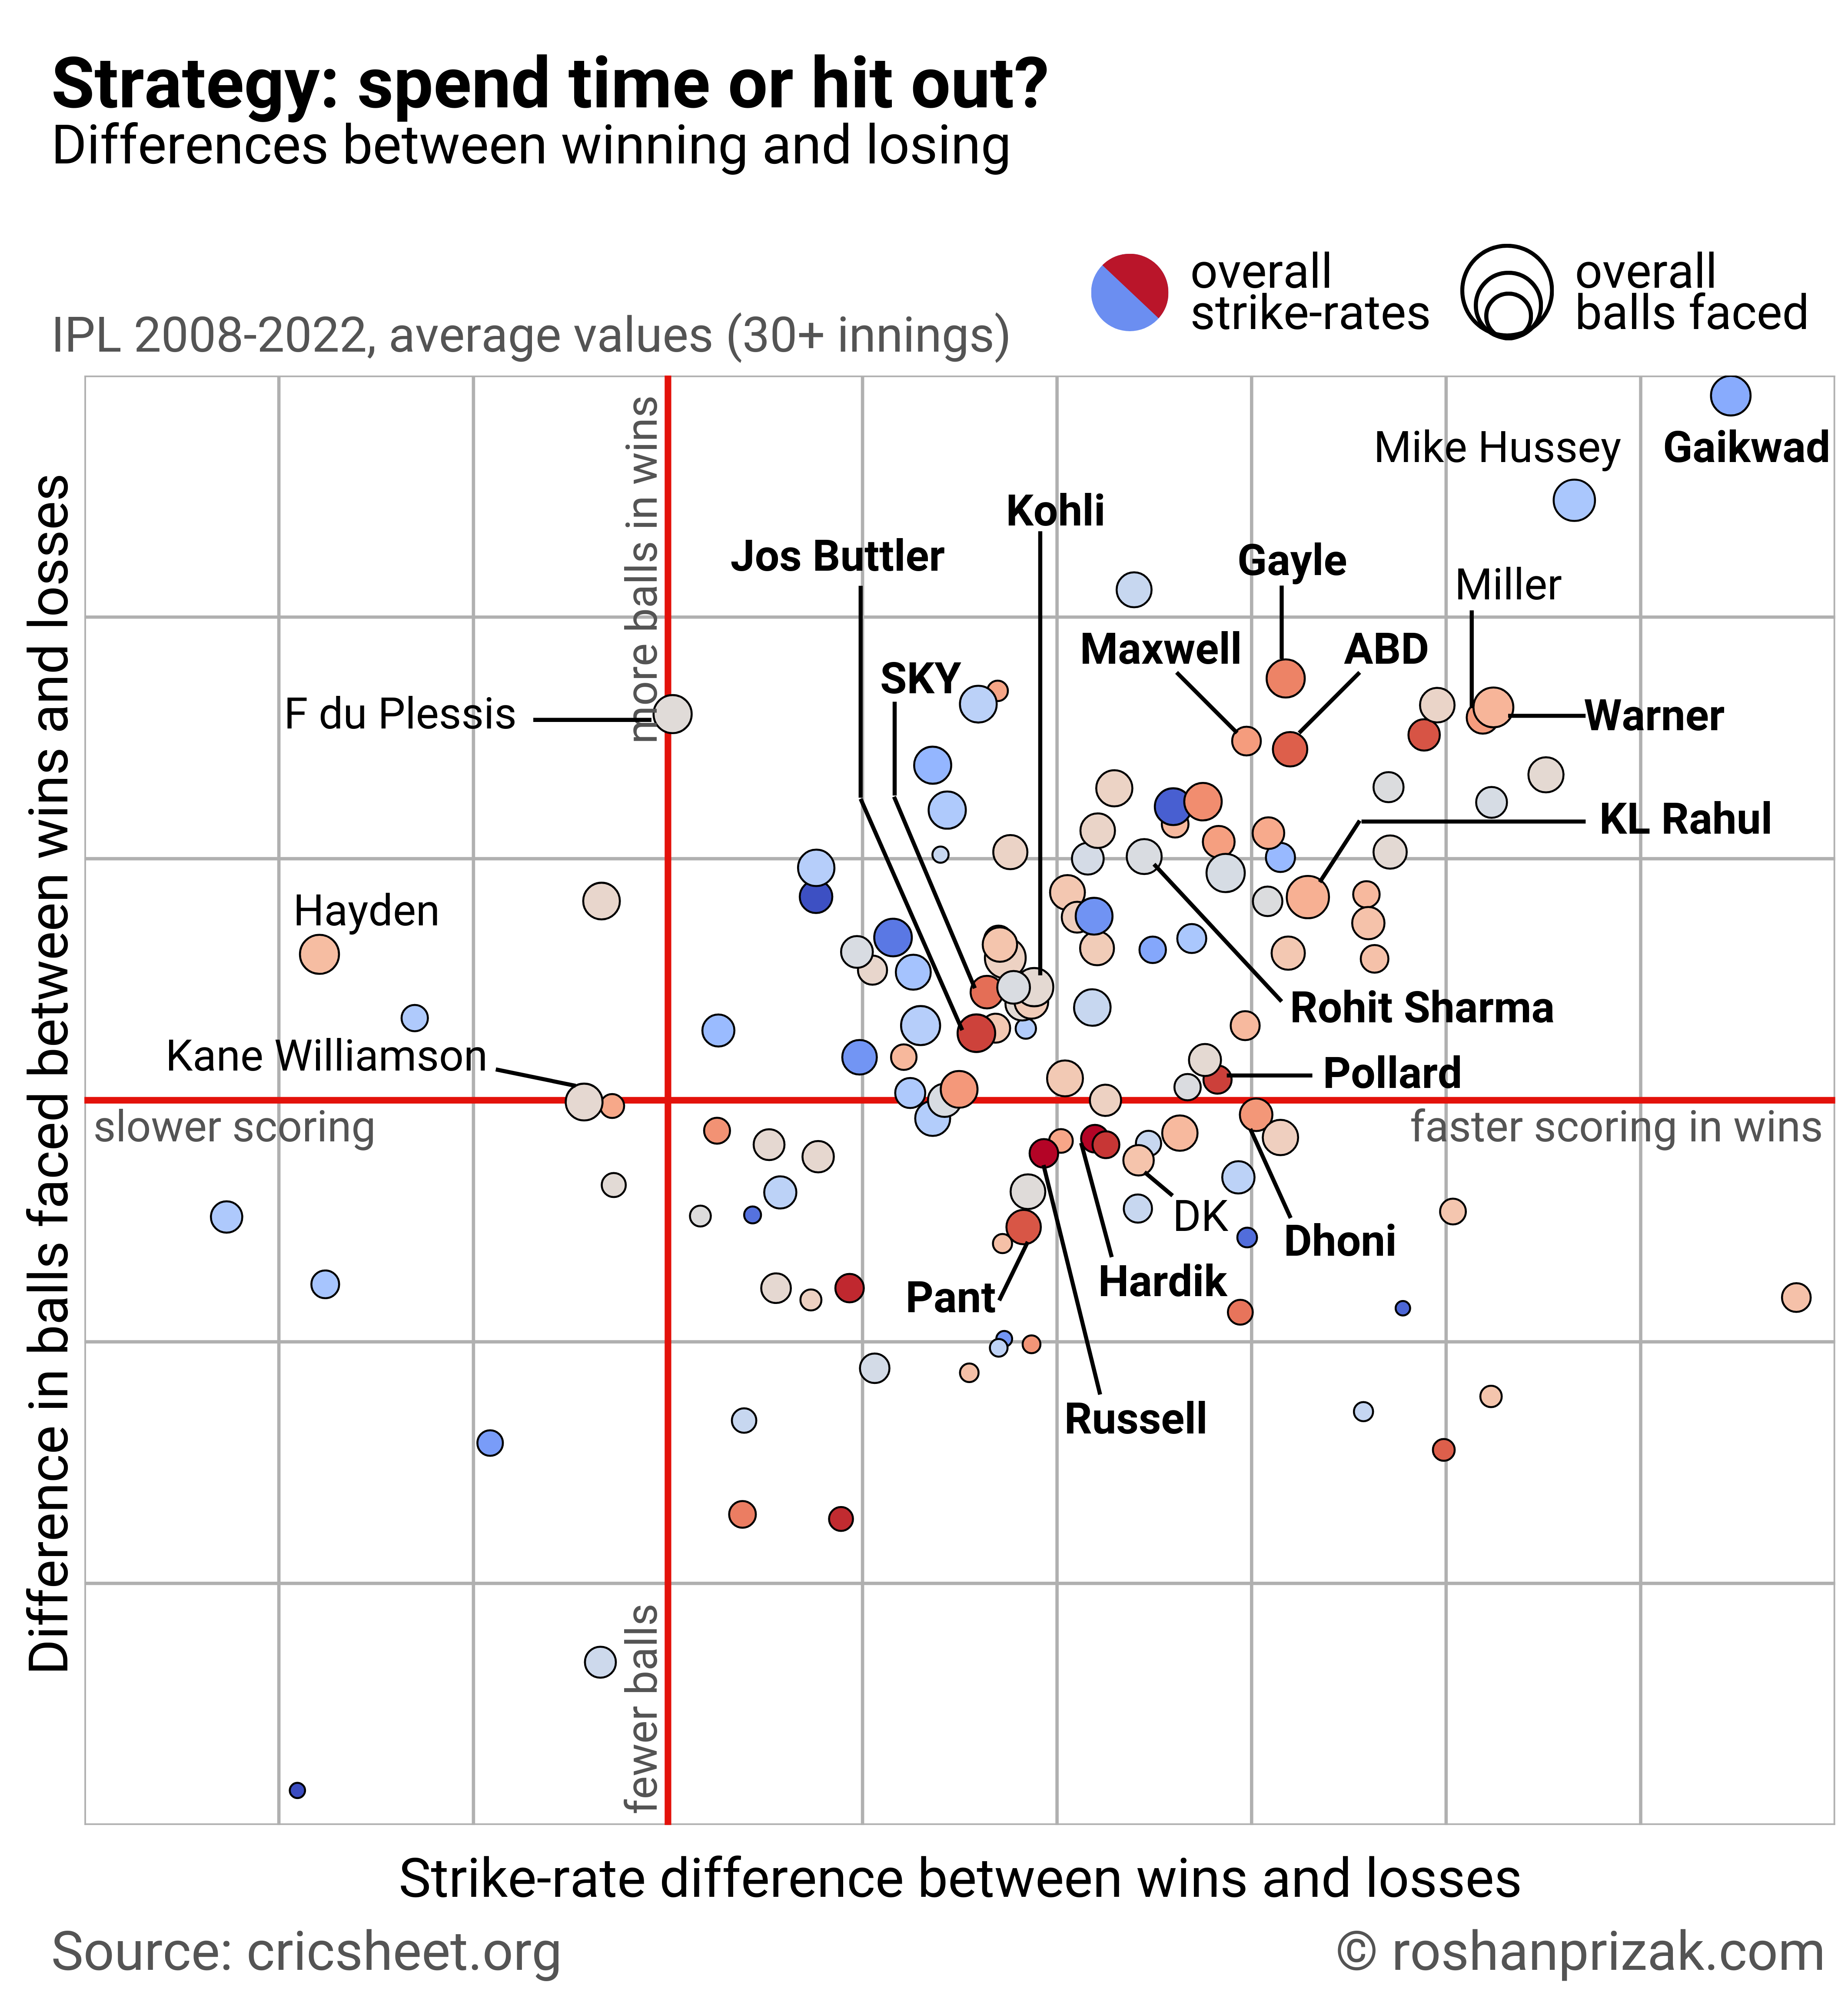
How is the calculation done? Percentile scores transform data into values between 0 and 1, making comparisons across datasets with different ranges easier. The percentile score of a particular value is the fraction of data that is smaller than the value. We do this for each batter separately for both strike-rates and balls faced. The percentile score of a particular strike-rate (in some particular innings) of a batter tells us how often the batter has scored slower than in that innings. So for the batter’s IPL career-best strike-rate, the percentile score would be 1 (signifying that the batter plays slower in all other innings), and for the batter’s IPL career-worst strike rate, the percentile score would be 0.
Interactive Plots
Here is an interactive version that presents these features of strike-rates, balls faced and their differences between wins and losses. You can select a subset of batting positions on the right to limit display to those positions. Hovering over a point would reveal the batter information, along with their average performance in wins and losses. When you hover, two small plots pop up on the right edge that reveal how strike-rates and balls faced differ between wins and losses in all individual innings of the batter. After hovering, you can click to label the batter even when you move the mouse away from the point.
/* ----------------------------------------------------------
Interactive plot showing average strike-rates and balls faced
-------------------------------------------------------------*/
{
  // Setting up the overall chart dimensions
  const margin = ({top: 20, right: 150, bottom: 50, left: 60})
  const visWidth = 450
  const visHeight = 450

  var textColor = d3.select("p").style("color")
  const greyTextColor = "#212529"

  // Setting up x and y scales to map from data values to pixel values
  const extentSR = [d3.min(data, function(d){return Math.min.apply(Math, [d.AvSRWin, d.AvSRLoss])}),
                d3.max(data, function(d){return Math.max.apply(Math, [d.AvSRWin, d.AvSRLoss])})];

  const extentBalls = [d3.min(data, function(d){return Math.min.apply(Math, [d.AvBallsWin, d.AvBallsLoss])}),
                d3.max(data, function(d){return Math.max.apply(Math, [d.AvBallsWin, d.AvBallsLoss])})];

  // Linear x-scale, domain and range set
  const x = d3.scaleLinear()
        .domain(extentSR).nice()
        .range([0, visWidth]);

  // Linear y-scale, domain and range set
  const y = d3.scaleLinear()
        .domain(extentBalls).nice()
        .range([visHeight, 0]);

  // Creating the x-axis and the y-axis, and their labels

  // Creating the x-axis
  const xAxis = (g, scale, label) =>
    g.attr("transform", `translate(0, ${visHeight})`)
        // add axis
        .call(d3.axisBottom(scale))
      // add label
      .append("text")
        .attr("x", visWidth / 2)
        .attr("y", margin.bottom-5)
        .attr("fill", textColor)
        .attr("text-anchor", "middle")
        .attr("font-family", "roboto")
        .attr("font-size", "18")
        .text(label)

  // Creating the y-axis
  const yAxis = (g, scale, label) =>
    // add axis
    g.call(d3.axisLeft(scale))
      // add label
      .append("text")
        .attr("transform", "rotate(-90)")
        .attr("x", -visHeight/2)
        .attr("y", -margin.left+20)
        .attr("fill", textColor)
        .attr("text-anchor", "middle")
        .attr("font-family", "roboto")
        .attr("font-size", "18")
        .text(label)

  // Creating the svg inside the visualization margins of the chart: this is where things can be drawn
  const svg = d3.create("svg")
      .attr("width", visWidth + margin.left + margin.right)
      .attr("height", visHeight + margin.top + margin.bottom);

  /* svg.append("rect")
    .attr("width", "100%")
    .attr("height", "100%")
    .attr("fill", "#ffffff"); */

  // Creating a main group to add things to visualize
  const g = svg.append("g")
      .attr("transform", `translate(${margin.left}, ${margin.top})`);

  // Attach axes to the main group
  g.append("g").call(xAxis, x, "Average strike-rate in innings →");
  g.append("g").call(yAxis, y, "Average no. of balls faced in innings →");
  // Change axes tick label fontsize
  g.selectAll(".tick text")
    .attr("font-size", 15)
    .attr("font-family", "roboto")

  // Drawing grid lines
  const grid = g.append('g');

  grid.append('rect')
    .attr('width', visWidth)
    .attr('height', visHeight)
    .attr('fill', 'white');

  let yLines = grid.append('g')
    .selectAll('line');

  let xLines = grid.append('g')
    .selectAll('line');

  function drawGridLines(x, y) {
    yLines = yLines.data(y.ticks())
      .join('line')
        .attr('stroke', '#d3d3d3')
        .attr('x1', 0)
        .attr('x2', visWidth)
        .attr('y1', d => 0.5 + y(d))
        .attr('y2', d => 0.5 + y(d));

    xLines = xLines.data(x.ticks())
      .join('line')
        .attr('stroke', '#d3d3d3')
        .attr('x1', d => 0.5 + x(d))
        .attr('x2', d => 0.5 + x(d))
        .attr('y1', d => 0)
        .attr('y2', d => visHeight);
  }

  // Allows to re-draw grid lines whenever necessary: like zooming in or updating the domains of the x and y axes
  drawGridLines(x, y);

  // Setting up a clipPath to hide data points outside of the visualization area
  g.append('clipPath')
      .attr('id', 'border')
    .append('rect')
      .attr('width', visWidth)
      .attr('height', visHeight);

  g.append('rect')
      .attr('width', visWidth)
      .attr('height', visHeight)
      .attr("stroke", "#000000")
      .style("stroke-width", 1)
      .attr('fill', 'none');

  // Setting up a group containing the base scatter points
  const baseCirclesGroup = g.append('g')
      .attr('clip-path', 'url(#border)');

  // Setting up a group containing the hover graphic elements
  const hoverElementsGroup = g.append('g')
      .attr('clip-path', 'url(#border)');

  // Creating a tooltip that is hidden by default
  const tooltip = g.append("g")
      .attr("id", "tp")
      .attr("visibility", "hidden");

  // Creating the x-axis
  const xAxisSide = (g, scale) =>
    g.attr("transform", `translate(0, 100)`)
        // add axis
        .call(d3.axisBottom(scale).ticks(10));
        // .call(g => g.select(".domain").remove());

  // Creating the y-axis
  const yAxisSide = (g, scale) =>
    // add axis
    g.call(d3.axisLeft(scale).ticks(10));
    //.call(g => g.select(".domain").remove());

  const sideAxisX = margin.left + visWidth + 30
  const sideAxisY = margin.top + 120

  var sideAxisGroupTop = svg.append("g")
      .attr("class", "side_axis")
      .attr("transform", `translate(${sideAxisX}, ${sideAxisY})`);

  sideAxisGroupTop.append('rect')
      .attr('width', 100)
      .attr('height', 100)
      .attr("stroke", "#000000")
      .style("stroke-width", 1)
      .attr('fill', 'none')
      .attr("visibility", "hidden");

  const sideAxisYAdded = sideAxisY + 120

  var sideAxisGroupBottom = svg.append("g")
      .attr("class", "side_axis")
      .attr("transform", `translate(${sideAxisX}, ${sideAxisYAdded})`);

  sideAxisGroupBottom.append('rect')
      .attr('width', 100)
      .attr('height', 100)
      .attr("stroke", "#000000")
      .style("stroke-width", 1)
      .attr('fill', 'none')
      .attr("visibility", "hidden");

  var all_SR = []
  var all_balls = []
  d3.range(data.length).forEach(function(xx, i) {
    all_SR = d3.merge([all_SR, data[xx].SR])
    all_balls = d3.merge([all_balls, data[xx].Balls])
  });
  const minSR = d3.min(all_SR)
  const maxSR = d3.quantile(all_SR, 0.99)
  const minBalls = d3.min(all_balls)
  const maxBalls = d3.max(all_balls)

  const xSide = d3.scaleLinear()
          .domain([minSR, maxSR])
          .range([0, 100]);

  // Linear y-scale, domain and range set
  const ySide = d3.scaleLinear()
        .domain([minBalls, maxBalls])
        .range([100, 0]);

  // Setting up a group containing the base scatter points
  const sideCirclesGroupTop = sideAxisGroupTop.append('g');
  const sideCirclesGroupBottom = sideAxisGroupBottom.append('g');

  // Setting up some values before starting to plot
  const baseRadius = 5
  const BattingPositions = ["Openers", "Middle-order", "Finishers", "Tail-enders"]
  const battingPositionColor = d3.scaleOrdinal()
    .domain(BattingPositions)
    .range(d3.schemeCategory10);

  // Drawing the base scatter points by attaching it to the data
  function drawPoints(in_data) {

    const meanBalls = d3.mean(in_data, function(d) {return d.AvBalls});
    var xMin = x.domain()[0];
    var xMax = x.domain()[1];

    const meanSR = d3.mean(in_data, function(d) {return d.AvSR});
    var yMin = y.domain()[0];
    var yMax = y.domain()[1];

    // Select all circles in the group and append a data point to each
    const baseCircles = baseCirclesGroup.selectAll('circle')
      .data(in_data)
      .join('circle')
        // draw points
        .attr("cx", d => x(d.AvSR))
        .attr("cy", d => y(d.AvBalls))
        .attr("fill", d =>  battingPositionColor(d.BattingPosition))
        .attr("r", baseRadius)
        .attr('stroke', "none")
        .attr('stroke-width', 1)
        .attr('opacity', 0.5)
        // Interactive functions:
        .on("mouseenter", mouseEnter)
        .on("mouseleave", mouseLeave)
        .on("click", clicked);

    // Adding a horizontal line
    g.append('line')
      .attr("id", "mean_balls")
      .attr("x1", x(xMin))
      .attr("y1", y(meanBalls))
      .attr("x2", x(xMax))
      .attr("y2", y(meanBalls))
      .style("stroke", "red");

    // Adding a vertical line
    g.append('line')
      .attr("id", "mean_sr")
      .attr("x1", x(meanSR))
      .attr("y1", y(yMin))
      .attr("x2", x(meanSR))
      .attr("y2", y(yMax))
      .style("stroke", "red");

  }

  // Function to draw equi-run lines, given an array of runs
  var line = d3.line()
  var SR_linspace
  function drawEquiRunLines(eqrs) {
    SR_linspace = d3.ticks(x.domain()[0], x.domain()[1], 1000);
    var balls_eqr
    var eqr_points
    // Equi-run lines
    for (let j = 0; j < eqrs.length; j++) {
      balls_eqr = new Array();
      eqr_points = new Array();
      for (let i = 0; i < SR_linspace.length; i++) {
        balls_eqr.push(eqrs[j]*100/SR_linspace[i]);
        if (balls_eqr[i]>=y.domain()[0] && balls_eqr[i]<=y.domain()[1]) {
          eqr_points.push([x(SR_linspace[i]), y(balls_eqr[i])]);
        }

      }

      g.append('path')
        .attr("class", "main_eqr_lines")
        .attr('d', line(eqr_points))
        .attr('stroke', '#a3a3a3')
        .style("stroke-dasharray", ("10,3"))
        .attr('fill', 'none');

      // Labeling the equi-run lines on the right-side of the plot
      g.append("text")
        .attr("class", "main_eqr_run_labels")
        .attr("dx", "0.5em")
        .attr("font-family", "roboto")
        .attr("font-size", 15)
        .attr("fill", textColor)
        .attr("y", y(eqrs[j]*100/(x.domain()[1]))) // offset it from the edge of the rectangle
        .attr("x", x(x.domain()[1])) // offset it from the edge of the rectangle
        .attr("dominant-baseline", "middle")
        .text(d3.format(".0f")(eqrs[j])+" runs");
    }
  }

  // Calling function to draw equi-run lines
  drawEquiRunLines([10, 20, 30, 40, 50])

  // Calling function to draw the base scatter plot on the given axes
  drawPoints(data)

  function dragstarted() {
    d3.select(this).attr("stroke", "black");
  }

  function dragged(event, d) {
    d3.select(this).raise().attr("cx", d.x = event.x).attr("cy", d.y = event.y);
  }

  function dragended() {
    d3.select(this).attr("stroke", null);
  }

  var drag = d3.drag()
      .on("start", dragstarted)
      .on("drag", dragged)
      .on("end", dragended);

  // Track which batting-positions are selected
  const highlighted = new Map(data.map(d => [d, true]));

  // Function to handle mouse enter events
  function mouseEnter(event, d, i) {

    // Remove labeling of highlighted labels, and equi-run lines
    g.selectAll(".highlighted_labels").remove()
    g.selectAll(".main_eqr_lines").attr("visibility", "hidden");
    g.selectAll(".main_eqr_run_labels").attr("visibility", "hidden");

    // y.domain([70,100])

    // Define the arrowhead marker variables
    const markerBoxWidth = 10;
    const markerBoxHeight = 10;
    const refX = markerBoxWidth / 2;
    const refY = markerBoxHeight / 2;
    const markerWidth = markerBoxWidth / 2;
    const markerHeight = markerBoxHeight / 2;
    const arrowPoints = [[0, 0], [0, 10], [10, 5]];

    // Add the arrowhead marker definition to the svg element
    svg
      .append('defs')
      .append('marker')
        .attr('id', 'arrow')
        .attr('viewBox', [0, 0, markerBoxWidth, markerBoxHeight])
        .attr('refX', refX)
        .attr('refY', refY)
        .attr('markerWidth', markerBoxWidth)
        .attr('markerHeight', markerBoxHeight)
        .attr('orient', 'auto-start-reverse')
      .append('path')
        .attr('d', d3.line()(arrowPoints))
        .attr('stroke', 'black');

    // Change opacity of all scatter points on hover
    baseCirclesGroup.selectAll('circle')
      .attr("stroke", "none")
      .attr("opacity", 0.75)
      .attr("fill", "#d3d3d3");

    var eqrs = [d.AvBallsLoss*d.AvSRLoss/100, d.AvBalls*d.AvSR/100, d.AvBallsWin*d.AvSRWin/100]
    var loss_runs_positions = ["hanging", "middle", "bottom"]
    var balls_eqr
    var eqr_points
    // Equi-run lines
    for (let j = 0; j < eqrs.length; j++) {
      balls_eqr = new Array();
      eqr_points = new Array();
      for (let i = 0; i < SR_linspace.length; i++) {
        balls_eqr.push(eqrs[j]*100/SR_linspace[i]);
        if (balls_eqr[i]>=y.domain()[0] && balls_eqr[i]<=y.domain()[1]) {
          eqr_points.push([x(SR_linspace[i]), y(balls_eqr[i])]);
        }
      }
      hoverElementsGroup.append('path')
        .attr("class", "hover_eqr_lines")
        .attr("pointer-events", "none")
        .attr('d', line(eqr_points))
        .attr('stroke', '#a3a3a3')
        .style("stroke-dasharray", ("10,3"))
        .attr('fill', 'none');

      if (j>0) {
        if (Math.round(eqrs[j])==Math.round(eqrs[j-1])) {
          continue;
        }
      }

      g.append("text")
        .attr("class", "loss_runs")
        .attr("dx", "0.5em")
        .attr("font-family", "roboto")
        .attr("font-size", 15)
        .attr("fill", greyTextColor)
        .attr("y", y(eqrs[j]*100/(x.domain()[1]))) // offset it from the edge of the rectangle
        .attr("x", x(x.domain()[1])-60) // offset it from the edge of the rectangle
        .attr("dominant-baseline", function(){
          if ((eqrs[2]>eqrs[0] && j==0) || (eqrs[2]<eqrs[0] && j==2)) {
            return "hanging"
          }
          if ((eqrs[2]>eqrs[0] && j==2) || (eqrs[2]<eqrs[0] && j==0)) {
            return "bottom"
          }
          if (j==1) {
            return "middle"
          }
        })
        .text(d3.format(".0f")(eqrs[j])+" runs");
    }

    hoverElementsGroup.append("circle")
        .attr("id", "win_sr_circle")
        .attr("pointer-events", "none")
        .attr("cx", x(d.AvSRWin))
        .attr("cy", y(d.AvBallsWin))
        .attr("fill", "none")
        .attr("r", 8)
        .attr('stroke', "#000000")
        .attr('stroke-width', 1)
        .attr('opacity', 1);

    hoverElementsGroup.append('line')
      .style('stroke', 'black')
      .attr("id", "loss_win")
      .attr("pointer-events", "none")
      .attr('marker-end', 'url(#arrow)')
      .attr("x1", x(d.AvSRLoss))
      .attr("y1", y(d.AvBallsLoss))
      .attr("x2", x(d.AvSRWin))
      .attr("y2", y(d.AvBallsWin));

    hoverElementsGroup.append("circle")
        .attr("id", "loss_sr_circle")
        .attr("pointer-events", "none")
        .attr("cx", x(d.AvSRLoss))
        .attr("cy", y(d.AvBallsLoss))
        .attr("fill", "#000000")
        .attr("r", 5)
        .attr('stroke', "#ffffff")
        .attr('stroke-width', 1)
        .attr('opacity', 1);

    hoverElementsGroup.append("text")
      .attr("id", "loss_label")
      .attr("pointer-events", "none")
      .attr("dy", "-1em")
      .attr("dx", d.AvSRWin>d.AvSRLoss? "1em" : "-1em")
      .attr("font-family", "roboto")
      .attr("font-size", 15)
      //.attr("font-weight", "bold")
      .attr("fill", greyTextColor)
      .attr("y", y(d.AvBallsLoss)) // offset it from the edge of the rectangle
      .attr("x", x(d.AvSRLoss)) // offset it from the edge of the rectangle
      .attr("dominant-baseline", "middle")
      .attr("text-anchor", d.AvSRWin>d.AvSRLoss? "end" : "start")
      .text("Loss");

    hoverElementsGroup.append("text")
      .attr("id", "win_label")
      .attr("pointer-events", "none")
      .attr("dy", "-1em")
      .attr("dx", d.AvSRWin>d.AvSRLoss? "1em" : "-1em")
      .attr("font-family", "roboto")
      .attr("font-size", 15)
      // .attr("font-weight", "bold")
      .attr("fill", greyTextColor)
      .attr("y", y(d.AvBallsWin)) // offset it from the edge of the rectangle
      .attr("x", x(d.AvSRWin)) // offset it from the edge of the rectangle
      .attr("dominant-baseline", "middle")
      .attr("text-anchor", d.AvSRWin>d.AvSRLoss? "end" : "start")
      .text("Win");

    tooltip.select("#tp")
      .raise();

    hoverElementsGroup.append("text")
    .attr("pointer-events", "none")
      .attr("id", "av_label")
      .attr("dy", "-1.2em")
      .attr("dx", "-0.5em")
      .attr("font-family", "roboto")
      .attr("font-size", 15)
      // .attr("font-weight", "bold")
      .attr("fill", greyTextColor)
      .attr("y", y(d.AvBalls)) // offset it from the edge of the rectangle
      .attr("x", x(d.AvSR)) // offset it from the edge of the rectangle
      .attr("dominant-baseline", "bottom")
      .text("All");

    // tooltipText.html(d.Name);
    tooltip.append("text")
      .attr("dy", "0em")
      .attr("font-family", "roboto")
      .attr("font-size", 20)
      .attr("font-weight", "bold")
      .attr("fill", greyTextColor)
      .attr("dominant-baseline", "hanging")
      .text(d.Name);

    var diff_sr = d.AvSRWin - d.AvSRLoss
    tooltip.append("text")
      .attr("dy", "1.1em") // you can vary how far apart it shows up
      .attr("font-family", "roboto")
      .attr("font-size", 18)
      .attr("dominant-baseline", "hanging")
      .text("SR: "+d3.format(".1f")(d.AvSR))
      .attr("fill", greyTextColor)
      .append("tspan")
        .attr("font-family", "roboto")
        .attr("font-size", 15)
        .attr("fill", greyTextColor)
        .attr("dominant-baseline", "hanging")
        .text(diff_sr>0? " +"+d3.format(".0f")(diff_sr): " "+d3.format(".0f")(diff_sr))
        .attr("fill", diff_sr>0? "green": "red");

    var diff_balls = d.AvBallsWin - d.AvBallsLoss

    tooltip.append("text")
      .attr("dy", "2.1em") // you can vary how far apart it shows up
      .attr("font-family", "roboto")
      .attr("font-size", 18)
      .attr("fill", greyTextColor)
      .attr("dominant-baseline", "hanging")
      .text("Balls: "+d3.format(".0f")(d.AvBalls))
      .append("tspan")
        .attr("font-family", "roboto")
        .attr("font-size", 15)
        .attr("fill", greyTextColor)
        .attr("dominant-baseline", "hanging")
        .text(diff_balls>0? " +"+d3.format(".0f")(diff_balls): " "+d3.format(".0f")(diff_balls))
        .attr("fill", diff_balls>0? "green": "red");

    d3.select(this)
        .attr("r", baseRadius * 3)
        .attr('opacity', 1)
        .raise()
        .attr("fill", battingPositionColor(d.BattingPosition));

    const xPos = 0.7*x(x.domain()[1])
    const yPos = 0.1*y(y.domain()[0])
    tooltip
      .attr("transform", `translate(${xPos},${yPos})`)
      .attr("visibility", "visible");

    // Add a side axis group for innings_points
    // Linear x-scale, domain and range set
    // xSide.domain(d3.extent(d.SR)).nice();
    // ySide.domain(d3.extent(d.Balls)).nice();

    // Making side axis group visible
    sideAxisGroupTop.attr("visibility", "visible");

    // Attach axes to the main group
    sideAxisGroupTop.append("g").call(xAxisSide, xSide);
    sideAxisGroupTop.append("g").call(yAxisSide, ySide);

    sideAxisGroupTop.selectAll(".tick line")
      .attr("visibility", "hidden");

    sideAxisGroupTop.selectAll("text").remove()

    sideAxisGroupBottom.attr("visibility", "visible");

    // Attach axes to the main group
    sideAxisGroupBottom.append("g").call(xAxisSide, xSide);
    sideAxisGroupBottom.append("g").call(yAxisSide, ySide);

    sideAxisGroupBottom.selectAll(".tick line")
      .attr("visibility", "hidden");

    sideAxisGroupBottom.selectAll("text").remove()

    sideAxisGroupBottom.append("text")
      .attr("font-family", "roboto")
      .attr("font-size", 15)
      .attr("fill", textColor)
      .attr("font-weight", "bold")
      .attr("dy", -5)
      .attr("dx", 100)
      .attr("dominant-baseline", "hanging")
      .attr("text-anchor", "end")
      .text("Wins");

    sideAxisGroupTop.append("text")
      .attr("font-family", "roboto")
      .attr("font-size", 15)
      .attr("fill", textColor)
      .attr("font-weight", "bold")
      .attr("dy", -5)
      .attr("dx", 100)
      .attr("dominant-baseline", "hanging")
      .attr("text-anchor", "end")
      .text("Losses");

    sideAxisGroupBottom.append("text")
      .attr("font-family", "roboto")
      .attr("font-size", 15)
      .attr("fill", textColor)
      .attr("dy", 110)
      .attr("dx", -3)
      .attr("dominant-baseline", "hanging")
      .text(minSR);

    sideAxisGroupBottom.append("text")
      .attr("font-family", "roboto")
      .attr("font-size", 15)
      .attr("fill", textColor)
      .attr("dy", 110)
      .attr("dx", 90)
      .attr("dominant-baseline", "hanging")
      .text(maxSR);

    sideAxisGroupBottom.append("text")
      .attr("font-family", "roboto")
      .attr("font-size", 15)
      .attr("fill", textColor)
      .attr("dy", 0)
      .attr("dx", -10)
      .attr("dominant-baseline", "middle")
      .attr("text-anchor", "end")
      .text(maxBalls);

    sideAxisGroupBottom.append("text")
      .attr("font-family", "roboto")
      .attr("font-size", 15)
      .attr("fill", textColor)
      .attr("dy", 100)
      .attr("dx", -10)
      .attr("dominant-baseline", "middle")
      .attr("text-anchor", "end")
      .text(minBalls);

    d3.range(d.SR.length).forEach(function(xx, i) {
      sideCirclesGroupTop.append('circle')
        .attr("class", "innings_points")
        // .attr('clip-path', 'url(#border)')
        .attr("pointer-events", "none")
        .attr("cx", xSide(d.SR[xx]))
        .attr("cy", ySide(d.Balls[xx]))
        .attr("r", 6)
        .attr("opacity", 0.5)
        .style("fill", "#b3b3b3")
        .style("stroke", "none");

      sideCirclesGroupBottom.append('circle')
        .attr("class", "innings_points")
        // .attr('clip-path', 'url(#border)')
        .attr("pointer-events", "none")
        .attr("cx", xSide(d.SR[xx]))
        .attr("cy", ySide(d.Balls[xx]))
        .attr("r", 6)
        .attr("opacity", 0.5)
        .style("fill", "#b3b3b3")
        .style("stroke", "none");

    });

    d3.range(d.SR.length).forEach(function(xx, i) {
      if (d.Won[xx]=="No") {
        sideCirclesGroupTop.append('circle')
          .attr("class", "innings_points")
          // .attr('clip-path', 'url(#border)')
          .attr("pointer-events", "none")
          .attr("cx", xSide(d.SR[xx]))
          .attr("cy", ySide(d.Balls[xx]))
          .attr("r", 2)
          .style("fill", "#FF6B6C")
          .style("stroke", "#000000")
          .style("stroke-width", 1);
      }

      if (d.Won[xx]=="Yes") {
        sideCirclesGroupBottom.append('circle')
          .attr("class", "innings_points")
          // .attr('clip-path', 'url(#border)')
          .attr("pointer-events", "none")
          .attr("cx", xSide(d.SR[xx]))
          .attr("cy", ySide(d.Balls[xx]))
          .attr("r", 2)
          .style("fill", "#B4BA39")
          .style("stroke", "#000000")
          .style("stroke-width", 1);
      }
    });
  }

  // Function to handle mouse leaving
  function mouseLeave(event, d) {

    sideAxisGroupTop.attr("visibility", "hidden")
    sideAxisGroupBottom.attr("visibility", "hidden")
    sideCirclesGroupTop.selectAll(".innings_points").remove()
    sideCirclesGroupBottom.selectAll(".innings_points").remove()
    g.select("#loss_win").remove()
    hoverElementsGroup.select("#loss_sr_circle").remove()
    hoverElementsGroup.select("#win_sr_circle").remove()
    hoverElementsGroup.select("#loss_label").remove()
    hoverElementsGroup.select("#win_label").remove()
    hoverElementsGroup.select("#av_label").remove()
    hoverElementsGroup.selectAll(".hover_eqr_lines").remove()
    hoverElementsGroup.selectAll(".innings_points").remove()
    g.selectAll(".highlighted_labels").remove()
    g.selectAll(".loss_runs").remove()
    g.selectAll(".main_eqr_lines")
        .attr("visibility", "visible");
    g.selectAll(".main_eqr_run_labels")
        .attr("visibility", "visible");

    baseCirclesGroup.selectAll('circle')
      .attr("stroke", d => highlighted.get(d)? "none" : "black")
      .attr("opacity", d => highlighted.get(d)? 0.5 : 1)
      .attr("fill", d =>  battingPositionColor(d.BattingPosition));

    baseCirclesGroup.selectAll('circle')  //here's how you get all the nodes
      .each(function(d) {
        if (!highlighted.get(d)) {
          g.append('text')
          .attr('class', 'highlighted_labels')
          .style('fill', greyTextColor)
          .attr("font-family", "roboto")
          .attr("font-size", 15)
          .attr("font-weight", "bold")
          .attr("dominant-baseline", "alphabetical")
          .attr("text-anchor", "start")
          .attr("x", x(d.AvSR)+baseRadius+1)
          .attr("y", y(d.AvBalls)-baseRadius-1)
          .text(d.Name);
        }
      });

    // reset the size of the circle
    d3.select(this)
      .attr("r", d => highlighted.get(d)? baseRadius : baseRadius * 1.5)
      .attr("stroke", d => highlighted.get(d)? "none" : "black")
      .attr("opacity", d => highlighted.get(d)? 0.5 : 1);

    tooltip.selectAll("text").remove()

    // make the tooltip invisible
    tooltip
        .attr("visibility", "hidden");
  }

  // Function to handle mouse clicks
  function clicked(event, d) {

    const isHighlighted = highlighted.get(d);

    d3.select(this)
        .raise()
        .attr("stroke", d => isHighlighted? "black" : "none")
        .attr("opacity", d => isHighlighted? 1 : 0.75);

    d3.select(this)
        .append("text")
        .attr("font-family", "roboto")
        .attr("font-size", 22)
        .attr("font-weight", "bold")
        .attr("dominant-baseline", "hanging")
        .text(d.Wins);

    highlighted.set(d, !isHighlighted);

  }

  // Draw legend
  const xShift = visWidth + margin.left
  const yShift = margin.top - 10
  const legend = svg.append('g')
      .attr('transform', `translate(${xShift}, ${yShift})`);

  legend.append("text")
    .text("Select type:")
    .attr('font-size', 15)
    .attr('dominant-baseline', 'middle')
    .attr("fill", textColor)
    .attr('text-anchor', 'start')
    .attr('font-family', 'roboto')
    .attr('x', 10)
    .attr('y', 5);

  const rows = legend.selectAll('g')
    .data(BattingPositions)
    .join('g')
      .attr('transform', (d, i) => `translate(20, ${(i+1) * 20})`);

  rows.append('rect')
      .attr('width', 15)
      .attr('height', 15)
      .attr('stroke-width', 2)
      .attr('stroke', d => battingPositionColor(d))
      .attr('fill', d => battingPositionColor(d))
      .on('click', onclick);

  rows.append('text')
      .attr('font-size', 15)
      .attr('x', 20)
      .attr('y', 7.5)
      .attr("fill", textColor)
      .attr('font-family', 'roboto')
      .attr('dominant-baseline', 'middle')
      .text(d => d)

  // Track which batting-positions are selected
  const selected = new Map(BattingPositions.map(d => [d, true]));

  function onclick(event, d) {
    const isSelected = selected.get(d);

    // select the square and toggle it
    const square = d3.select(this);
    square.attr('fill', d => isSelected ? 'white' : battingPositionColor(d));
    selected.set(d, !isSelected);

    // redraw the points
    svg.select("#mean_balls").remove()
    svg.select("#mean_sr").remove()
    g.selectAll(".highlighted_labels").remove()
    drawPoints(data.filter(d => selected.get(d.BattingPosition)));

    baseCirclesGroup.selectAll('circle')  //here's how you get all the nodes
      .each(function(d) {
        if (!highlighted.get(d)) {
          g.append('text')
            .attr('class', 'highlighted_labels')
            .style('fill', greyTextColor)
            .attr("font-family", "roboto")
            .attr("font-size", 15)
            .attr("font-weight", "bold")
            .attr("dominant-baseline", "alphabetical")
            .attr("text-anchor", "start")
            .attr("x", x(d.AvSR)+baseRadius+1)
            .attr("y", y(d.AvBalls)-baseRadius-1)
            .text(d.Name);
            //.call(drag);
            //.call(d3.drag().on("start", dragstarted))
            //.call(d3.drag().on("drag", dragged))
            //.call(d3.drag().on("end", dragended));
        }
      });

    baseCirclesGroup.selectAll('circle')
      .attr("stroke", d => highlighted.get(d)? "none" : "black")
      .attr("r", d => highlighted.get(d)? baseRadius : baseRadius * 1.5)
      .attr("opacity", d => highlighted.get(d)? 0.25 : 1)
      .attr("fill", d =>  battingPositionColor(d.BattingPosition));

  }

  return svg.node();
}
Below is an interactive plot of how different batters did (strike-rates and balls faced) in their IPL innings when their team won and lost, compared to the overall distribution of how batters do in general.
// ["V Kohli", "AB de Villiers", "MS Dhoni"]
viewof chosen_batter = Inputs.select(all_batter_names, {value: 'V Kohli', label: 'Choose batter'})
{
// Setting up the overall chart dimensions
const margin = ({top: 5, right: 65, bottom: 50, left: 60})
const visWidth = 600
const visHeight = 400
var textColor = d3.select("p").style("color")
const greyTextColor = "#212529"
var all_SR = []
var all_balls = []
d3.range(data.length).forEach(function(xx, i) {
all_SR = d3.merge([all_SR, data[xx].SR])
all_balls = d3.merge([all_balls, data[xx].Balls])
});
const minSR = d3.min(all_SR)
const maxSR = d3.quantile(all_SR, 0.99)
const minBalls = d3.min(all_balls)
const maxBalls = d3.max(all_balls)
const dx = 10
const dy = 4
const xScale = d3.scaleLinear()
.domain([minSR-dx/2, maxSR+dx/2])
.range([0, visWidth]);
// Linear y-scale, domain and range set
const yScale = d3.scaleLinear()
.domain([minBalls-dy/2, maxBalls+dy/2])
.range([visHeight, 0]);
// Creating the x-axis and the y-axis, and their labels
// Creating the x-axis
const xAxis = (g, scale, label) =>
g.attr("transform", `translate(0, ${visHeight})`)
// add axis
.call(d3.axisBottom(scale))
// add label
.append("text")
.attr("x", visWidth / 2)
.attr("y", margin.bottom-5)
.attr("fill", textColor)
.attr("text-anchor", "middle")
.attr("font-family", "roboto")
.attr("font-size", "18")
.text(label)
// Creating the y-axis
const yAxis = (g, scale, label) =>
// add axis
g.call(d3.axisLeft(scale))
// add label
.append("text")
.attr("transform", "rotate(-90)")
.attr("x", -visHeight/2)
.attr("y", -margin.left+20)
.attr("fill", textColor)
.attr("text-anchor", "middle")
.attr("font-family", "roboto")
.attr("font-size", "18")
.text(label)
// Creating the svg inside the visualization margins of the chart: this is where things can be drawn
const svg = d3.create("svg")
.attr("width", visWidth + margin.left + margin.right)
.attr("height", visHeight + margin.top + margin.bottom);
// Creating a main group to add things to visualize
const g = svg.append("g")
.attr("transform", `translate(${margin.left}, ${margin.top})`);
// Attach axes to the main group
g.append("g").call(xAxis, xScale, "Strike-rate in each innings →");
g.append("g").call(yAxis, yScale, "No. of balls faced in each innings →");
// Change axes tick label fontsize
g.selectAll(".tick text")
.attr("font-size", 15)
.attr("font-family", "roboto")
g.append('rect')
.attr('width', visWidth)
.attr('height', visHeight)
.attr("stroke", "#000000")
.style("stroke-width", 1)
.attr('fill', 'none');
// Drawing grid lines
const grid = g.append('g');
grid.append('rect')
.attr('width', visWidth)
.attr('height', visHeight)
.attr('fill', 'white');
let yLines = grid.append('g')
.selectAll('line');
let xLines = grid.append('g')
.selectAll('line');
function drawGridLines(x, y) {
yLines = yLines.data(y.ticks())
.join('line')
.attr('stroke', '#d3d3d3')
.attr('x1', 0)
.attr('x2', visWidth)
.attr('y1', d => 0.5 + y(d))
.attr('y2', d => 0.5 + y(d));
xLines = xLines.data(x.ticks())
.join('line')
.attr('stroke', '#d3d3d3')
.attr('x1', d => 0.5 + x(d))
.attr('x2', d => 0.5 + x(d))
.attr('y1', d => 0)
.attr('y2', d => visHeight);
}
// Allows to re-draw grid lines whenever necessary: like zooming in or updating the domains of the x and y axes
// drawGridLines(xScale, yScale);
// Setting up a clipPath to hide data points outside of the visualization area
g.append('clipPath')
.attr('id', 'border2')
.append('rect')
.attr('width', visWidth)
.attr('height', visHeight);
// Setting up a group containing the base scatter points
const baseCirclesGroup = g.append('g')
.attr('clip-path', 'url(#border2)');
// Creating a tooltip that is hidden by default
const tooltip = svg.append("g")
.attr("id", "tp")
.attr("visibility", "hidden");
// Setting up some values before starting to plot
const baseRadius = 8
function rectBinner(xData, yData, dx, dy) {
const xMin = d3.min(xData)
const xMax = d3.max(xData)
const yMin = d3.min(yData)
const yMax = d3.max(yData)
const nx = Math.round((xMax-xMin)/dx) + 1
const ny = Math.round((yMax-yMin)/dy) + 1
var RectCount = []
let x = xMin - dx/2
let y = yMin - dy/2
d3.range(nx*ny*2).forEach( function(xx, i) {
if (y>yMax) {
return RectCount
}
if (x>xMax) {
x = xMin - dx/2;
y = y + dy;
} else {
// Do something
var count = 0
d3.range(xData.length).forEach(function(xx, i) {
if (xData[xx]>=x && xData[xx]<(x+dx) && yData[xx]>=y && yData[xx]<(y+dy)){
count = count + 1
}
});
if (count>0) {
RectCount.push({"x": x, "y": y, "c": Math.log10(count)});
}
x = x + dx;
}
});
return RectCount
}
var inningsColor = []
d3.range(data.length).forEach(function(xx, i) {
if (data[xx].Name==chosen_batter) {
d3.range(data.length).forEach(function(yy, j) {
if (data[xx].Won[yy]=="Yes"){
inningsColor.push("#B4BA39");
} else {
inningsColor.push("#FF6B6C");
}
});
}
});
function drawPoints(in_data) {
// Select all circles in the group and append a data point to each
var rectCounts = rectBinner(in_data[0], in_data[1], dx, dy)
const color = d3.scaleSequential(d3.interpolateGreys)
.domain([0, d3.max(rectCounts, d => d.c) / 2]);
baseCirclesGroup.append("g")
.attr("stroke", "#000")
.attr("stroke-opacity", 0.2)
.selectAll("rect")
.data(rectCounts)
.join("rect")
// .attr("transform", d => `translate(${d.x},${d.y})`)
.attr('x', d => xScale(d.x))
.attr('y', d => yScale(d.y))
.attr('width', xScale(dx)-xScale(0))
.attr('height', yScale(0)-yScale(dy))
.attr("fill", d => color(d.c))
.attr("opacity", 0.75);
d3.range(data.length).forEach(function(xx, i) {
if (data[xx].Name==chosen_batter) {
d3.range(data.length).forEach(function(yy, j) {
baseCirclesGroup
.append('circle')
.attr("class", "innings_circles")
.attr("cx", xScale(data[xx].SR[yy]+(d3.randomUniform(1)()-1)/2))
.attr("cy", yScale(data[xx].Balls[yy]+(d3.randomUniform(1)()-1)/2))
.attr("fill", data[xx].Won[yy]=="Yes"? "#B4BA39": "#FF6B6C")
.attr("r", 4)
.attr('stroke', "#ffffff")
.attr('stroke-width', 1)
.attr('opacity', 0.75)
// Interactive functions:
.on("mouseenter", function(e){
mouseEnter(e, yy)
})
.on("mouseleave", function(e){
mouseLeave(e, yy)
});
// .on("click", clicked);
});
}
});
}
// Function to draw equi-run lines, given an array of runs
var line = d3.line()
var SR_linspace
function drawEquiRunLines(eqrs) {
SR_linspace = d3.ticks(xScale.domain()[0], xScale.domain()[1], 1000);
var balls_eqr
var eqr_points
// Equi-run lines
for (let j = 0; j < eqrs.length; j++) {
balls_eqr = new Array();
eqr_points = new Array();
for (let i = 0; i < SR_linspace.length; i++) {
balls_eqr.push(eqrs[j]*100/SR_linspace[i]);
if (balls_eqr[i]>=yScale.domain()[0] && balls_eqr[i]<=yScale.domain()[1]) {
eqr_points.push([xScale(SR_linspace[i]), yScale(balls_eqr[i])]);
}
}
g.append('path')
.attr("class", "main_eqr_lines")
.attr('d', line(eqr_points))
.attr('stroke', '#a3a3a3')
.style("stroke-dasharray", ("10,3"))
.attr('fill', 'none');
// Labeling the equi-run lines on the right-side of the plot
g.append("text")
.attr("class", "main_eqr_run_labels")
.attr("dx", "0.5em")
.attr("font-family", "roboto")
.attr("font-size", 15)
.attr("fill", textColor)
.attr("y", yScale(eqrs[j]*100/(xScale.domain()[1]))) // offset it from the edge of the rectangle
.attr("x", xScale(xScale.domain()[1])) // offset it from the edge of the rectangle
.attr("dominant-baseline", "middle")
.text(d3.format(".0f")(eqrs[j])+" runs");
}
}
// Calling function to draw equi-run lines
drawEquiRunLines([10, 20, 30, 40, 50, 60, 75, 100])
drawPoints([all_SR, all_balls], chosen_batter);
function getFirstLetters(str) {
const firstLetters = str
.split(' ')
.map(word => word[0])
.join('');
return firstLetters;
}
function mouseEnter(event, yy) {
// Change opacity of all scatter points on hover
baseCirclesGroup.selectAll('circle')
.attr("stroke", "none")
.attr("opacity", 0.75)
.attr("fill", "#d3d3d3");
tooltip.select("#tp")
.raise();
const xPos = 0.8*xScale(xScale.domain()[1])
const yPos = 0.1*yScale(yScale.domain()[0])
tooltip
.attr("transform", `translate(${xPos},${yPos})`)
.attr("visibility", "visible");
d3.range(data.length).forEach(function(xx, i) {
if (data[xx].Name==chosen_batter) {
tooltip.append("text")
.attr("dy", "0em")
.attr("font-family", "roboto")
.attr("font-size", 20)
.attr("fill", greyTextColor)
.attr("font-weight", "bold")
.attr("dominant-baseline", "hanging")
.text(data[xx].Name);
tooltip.append("text")
.attr("dy", "1.1em") // you can vary how far apart it shows up
.attr("font-family", "roboto")
.attr("font-size", 18)
.attr("fill", greyTextColor)
.attr("dominant-baseline", "hanging")
.text(data[xx].Runs[yy]+" ("+data[xx].Balls[yy]+")");
tooltip.append("text")
.attr("dy", "2.6em") // you can vary how far apart it shows up
.attr("font-family", "roboto")
.attr("font-size", 15)
.attr("fill", greyTextColor)
.attr("dominant-baseline", "hanging")
.text(getFirstLetters(data[xx].Team[yy])+" vs "+getFirstLetters(data[xx].OppTeam[yy])+" ("+data[xx].TeamType[yy]+")");
tooltip.append("text")
.attr("dy", "3.7em") // you can vary how far apart it shows up
.attr("font-family", "roboto")
.attr("font-size", 15)
.attr("fill", greyTextColor)
.attr("dominant-baseline", "hanging")
.text(data[xx].Date[yy]);
event.target.r.baseVal.value = 12
event.target.style.opacity = 1
event.target.style.fill = data[xx].Won[yy]=="Yes"? "#B4BA39": "#FF6B6C"
event.target.style.stroke = "#ffffff"
}
});
}
function mouseLeave(event) {
tooltip.attr("visibility", "hidden");
tooltip.selectAll("text").remove()
baseCirclesGroup.selectAll(".innings_circles").remove()
d3.range(data.length).forEach(function(xx, i) {
if (data[xx].Name==chosen_batter) {
d3.range(data.length).forEach(function(yy, j) {
baseCirclesGroup
.append('circle')
.attr("class", "innings_circles")
.attr("cx", xScale(data[xx].SR[yy]+(d3.randomUniform(1)()-1)/2))
.attr("cy", yScale(data[xx].Balls[yy]+(d3.randomUniform(1)()-1)/2))
.attr("fill", data[xx].Won[yy]=="Yes"? "#B4BA39": "#FF6B6C")
.attr("r", 4)
.attr('stroke', "#ffffff")
.attr('stroke-width', 1)
.attr('opacity', 0.75)
// Interactive functions:
.on("mouseenter", function(e){
mouseEnter(e, yy)
})
.on("mouseleave", function(e){
mouseLeave(e, yy)
});
});
}
});
}
return svg.node();
}